Have you ever tried to print or download a document from HeinOnline, only to be redirected to a message that says the section exceeds the 200 page limit? The 200 page limit is in place to protect large PDF downloads which cause system overhead, as well as prevent systematic downloading of content. If you need to download a document that exceeds 200 pages, don’t be discouraged. We’ll walk you through how to get all the pages you need in this blog post!
Custom Page Range to the Rescue
Let’s say we’re researching a specific Senate Report in the U.S. Congressional Serial Set. We pull up House Report 101-316, the National Affordable Housing Act. After perusing through the document, we decide we want to download this report. Naturally, the first thing we do is click the PDF icon found above the document.
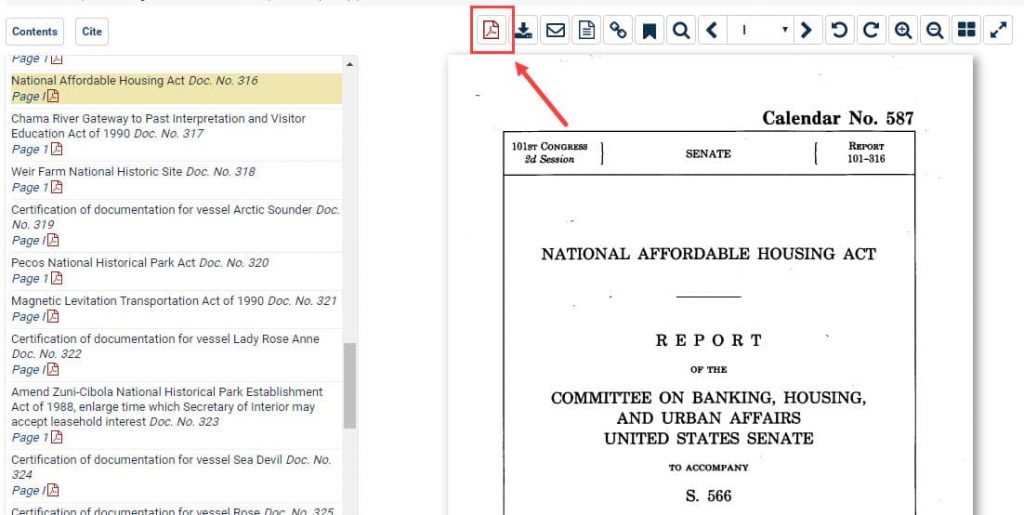
Normally, a PDF of the report would automatically download. However, since this report is 308 pages long, it exceeds the maximum number of pages which can be downloaded in HeinOnline. We are then redirected to the Print/Download Options page with a note that reads, “Printing limitation is set to a maximum of 200 pages.”
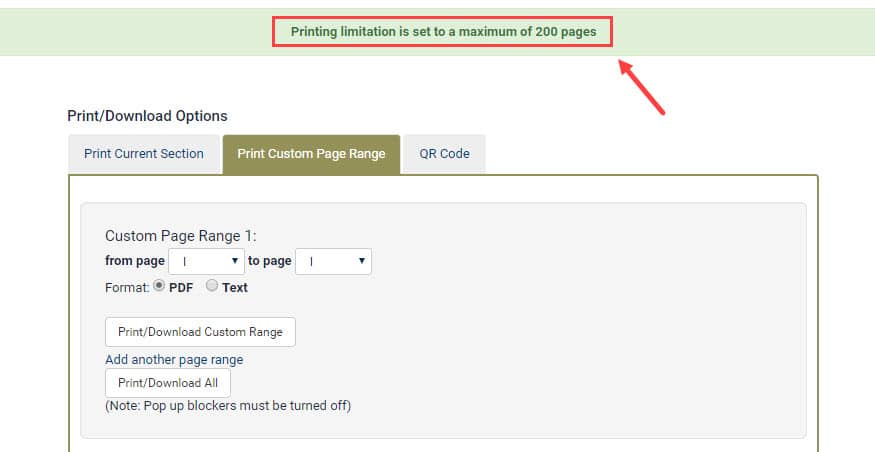
The good new is that HeinOnline has redirected us to the Print Custom Page Range option! From here, users can plug in a custom page range which does not exceed 200 pages in order to download the document in two parts. Since this document begins with 4 roman numerals, we need to take those into account as well. Using the Print Custom Page Range option, plug in roman numeral I to page 196.
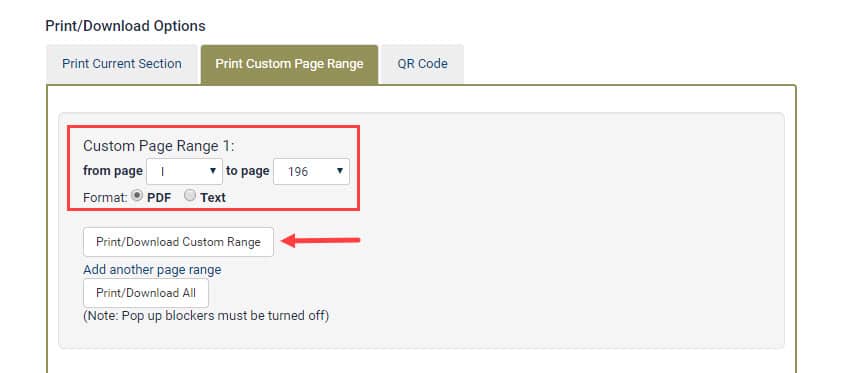
This will download the chosen pages. Next, using the same Print Custom Page Range option, select pages 197 to 308 to finish downloading the report.
Note: The same rule applies for printing. For example, if we were to decide to print this report we would choose the Print/Download icon found above the document.
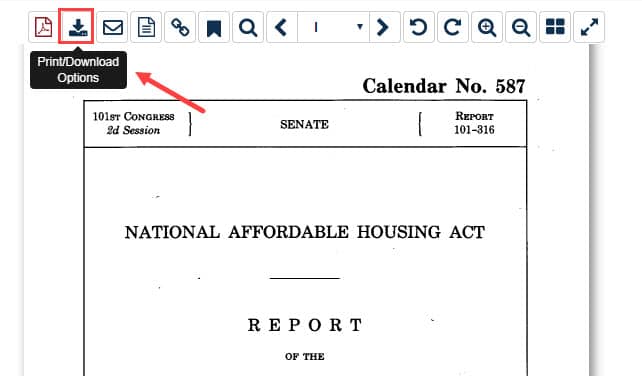
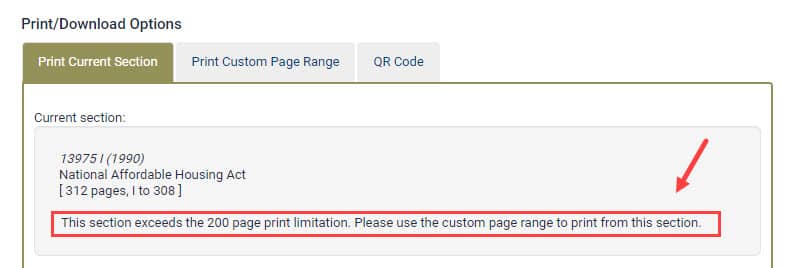
HeinOnline would automatically redirect us to the Print Custom Page Range option. If we were to click the Print Current Section option, we would see a message that reads “This section exceeds the 200 page print limitation. Please use the custom page range to print from this section.”
Pro Tip: The Custom Page Range option is great for documents which exceed 200 pages, but it’s also useful if you’re only interested in downloading or printing a specific section or page range within an article or document.
Need Help?
Stay tuned each week for a new tip! Don’t forget that HeinOnline search gurus are available at your fingertips: Email us, chat us, or call us at (800) 277-6995!
For more tips, check out these recent blog posts: